Description
As digital map-making tools are getting increasingly ubiquitous their use and critical assessment in policy making, research and pedagogy is more important than ever, especially in the ways they tend to reproduce established patterns of urban inequalities, dispossession, and environmental racism. In this workshop we will use open urban and spatio-temporal datasets that capture different contemporary and historical aspects of urban environments to explore different tools and scales of creating and using spatial stories in a class environment. We will focus on browser-based tools such as Story Maps, StoryMap.js, Timeline.js and Timemapper. At the end of the workshop we will review some projects and cases of “radical cartography” that challenge established map-making notions and practices and that can help students engage critically with dominant narratives and representations of urban and historic environments.
What you’ll need
Technical requirements
-
up-to-date browser (Chrome or Firefox preferred)
-
Desktop or mobile Zoom app
Access to online tools and services
-
CUNY Commons group and site
-
Google Drive / Google Sheets (optional)
-
NYC Open Data (free): https://opendata.cityofnewyork.us/
-
Recogito (optional): https://recogito.pelagios.org/
-
http://timeline.knightlab.com/ (setting up account required)
-
https://storymap.knightlab.com/ (setting up account required)
Materials
-
Workshop slides (link to be provided here)
-
New York City Museums .csv dataset download link https://data.cityofnewyork.us/Recreation/New-York-City-Museums/ekax-ky3z.csv and Google Sheet link: https://docs.google.com/spreadsheets/d/1feLpnWPspTGf9awoST7VvrVcg8_tKFBs7TrDD7aWJZ8/edit?usp=sharing
-
Catalogue of Ships (fragment) from the Iliad .txt file: https://cuny907-my.sharepoint.com/:t:/g/personal/dimitrios_papadopoulos43_login_cuny_edu/EapxL0QYb5JPuzoQ9knoqxgBJFnkAIFUdtjq-xGnea6Q3Q?e=ITuMxS
-
Source: https://www.perseus.tufts.edu/hopper/text?doc=Perseus%3Atext%3A1999.01.0134%3Abook%3D2%3Acard%3D546
-
Hom. Il. 2.546. Homer. The Iliad with an English Translation by A.T. Murray, Ph.D. in two volumes. Cambridge, MA., Harvard University Press; London, William Heinemann, Ltd. 1924.
-
“Refugee Crisis” Timeline.js template:
-
https://docs.google.com/spreadsheets/d/16UKKav6ysQL_QwKO-cK_DZ91ve1T1R1ivnbfcnqO_ac/edit?usp=sharing
Questions to consider:
-
How often do you use maps and geospatial data in your classes?
-
In what format?
-
What are some of the requirements or conditions that would make it easier for you to integrate geo-spatial/urban data and digital maps in your classes?
Working with spatio-temporal data
-
Download the New York City Museums .csv here: https://data.cityofnewyork.us/Recreation/New-York-City-Museums/ekax-ky3z.csv
-
and upload the file on Google Sheets OR
directly make a copy of the Google Spreadsheet here:
https://docs.google.com/spreadsheets/d/1feLpnWPspTGf9awoST7VvrVcg8_tKFBs7TrDD7aWJZ8/edit?usp=sharing
-
Install the “Geocode” extension for Google Sheets. https://gsuite.google.com/marketplace/app/geocode_by_awesome_table/904124517349
-
Return to your spreadsheet and create two empty columns following the “ADDRESS 2” column.
-
Select all cell values under “ADDRESS 1” and then click “Add-ons” > “Geocode” > “Start Geocoding’.” Hit “Geocode.”
-
Define “ADDRESS 1” as the address column.
-
This will generate Lat/Long value in the empty columns. You can now create, customize and open a map with your values.
Alternative tool: batchgeo.com
-
Return to Step 3. Copy all spreadsheet content into the text field on batchgeo.com.
-
Under “Validate & Set Options” define “ADRESS1” as Location / Address and “ZIP” in “Group By / Thematic Value.”
-
Click on “Make Map.” Add a title or discription (optional).
-
Enter an email address (required) and click on “Save Map.”
Example 2: Working with the Iliad and Recogito
-
Download the Iliad (fragment) .txt file here: https://cuny907-my.sharepoint.com/:t:/g/personal/dimitrios_papadopoulos43_login_cuny_edu/EapxL0QYb5JPuzoQ9knoqxgBJFnkAIFUdtjq-xGnea6Q3Q?e=ITuMxS
Source: https://www.perseus.tufts.edu/hopper/text?doc=Perseus%3Atext%3A1999.01.0134%3Abook%3D2%3Acard%3D546
Hom. Il. 2.546. Homer. The Iliad with an English Translation by A.T. Murray, Ph.D. in two volumes. Cambridge, MA., Harvard University Press; London, William Heinemann, Ltd. 1924.
-
Got to https://recogito.pelagios.org/ and create a user account (registration required). Recogito is an open source software tool for historical text annotation, name entity recognition and mapping. Here’s a 10-minute tutorial:
-
Once you set up an account. log in and then click on “Add” ? “File Upload”.
-
Upload the text file.
-
Locate the Iliad_1 text file listed and from the “Options” (top right) select “Named Entity Recognition.”
-
Select “Stanford CoreNLP” as the preferred engine.
-
Click “Start NER.”
-
Go back to the listed .txt file and select “Quick view” for “Places” and “Persons” and then “Map View”.
-
Click on “Download Options” to export your project.
Map-making tools and projects
We will review popular and effective digital map-making tools and some of the projects that have been developed with the use of such tools.
Spatial stories and time-lines: Storymap.js and Timeline.js
-
Storymap chronology (CUNY Commons Embed): https://dhccny.commons.gc.cuny.edu/chronology_storymap/
-
Storymap chronology (full size): https://uploads.knightlab.com/storymapjs/81d0baa63d26194ec17562ec1f76e08b/a-chronology-of-the-refugee-crisis-in-europe/index.html
-
Timeline chronology (CUNY Commons Embed): https://dhccny.commons.gc.cuny.edu/chronology_timeline/
-
Timeline chronology (full size): https://cdn.knightlab.com/libs/timeline3/latest/embed/index.html?source=16UKKav6ysQL_QwKO-cK_DZ91ve1T1R1ivnbfcnqO_ac&font=Default&lang=en&timenav_position=top&initial_zoom=2&height=650
You can embed and post any examples you would like to share on our demo space (edit or create new post under Demo > Storymap or Demo > Timeline).
Creating the storymap
Go to https://storymap.knightlab.com/ and create an account to make a storymap. Use the infromigrants.net chronology to recreate the storymap using any of the media sources below or your own combination.
Here’s a short video on how to create a storymap: https://www.youtube.com/watch?v=rSw3ZO8gDgc
Follow the steps to create and publish the storymap.
Creating the timeline
Go to http://timeline.knightlab.com/ and create an account to make a timeline.
Make a copy of the “Refugee Crisis” template: https://docs.google.com/spreadsheets/d/16UKKav6ysQL_QwKO-cK_DZ91ve1T1R1ivnbfcnqO_ac/edit?usp=sharing
Follow the steps on http://timeline.knightlab.com/ to create, publish and embed your timeline.
Chronology and media sources:
-
A chronology of the refugee crisis in Europe: https://www.infomigrants.net/en/post/10021/a-chronology-of-the-refugee-crisis-in-europe-1
-
The refugee crisis in Europe – a chronology: https://www.youtube.com/watch?v=WFJRgBzjC7c
-
Migration to Europe – why now? BBC News: https://www.youtube.com/watch?v=cScllA3cpL0
-
Race against time for migrants on Balkans route | DW News: https://www.youtube.com/watch?v=XPqhrgIx5Ic
-
Cutting Through Hungary’s Razor Wire Fence: Breaking Borders: https://www.youtube.com/watch?v=4XB2wKAjaVQ
-
Europe Tries to Shut Down Routes as Migrant Flow Intensifies:
-
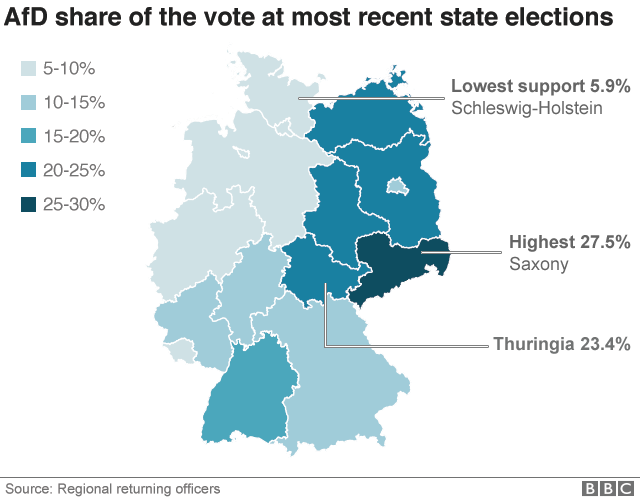
Germany’s AfD: How right-wing is nationalist Alternative for Germany?
-
‘Better to Drown’: A Greek Refugee Camp’s Epidemic of Misery https://www.nytimes.com/2018/10/02/world/europe/greece-lesbos-moria-refugees.html
Additional Resources
-
Bagnall, Roger, Richard J. A. Talbert, Sarah Bond, Jeffrey Becker, Tom Elliott, Sean Gillies, Ryan Horne, et al. “Pleiades: A Community-Built Gazetteer and Graph of Ancient Places.” Collection. Institute for the Study of the Ancient World, New York University, 2006. http://pleiades.stoa.org.
-
“Batch Geocoder for Journalists.” Accessed August 16, 2020. https://geocode.localfocus.nl/.
-
Canadian GIS & Geomatics. “Canadian Open Data and Free Geospatial Data,” October 26, 2010. https://canadiangis.com/data.php.
-
Data, City of New York, NYC Open. “NYC Open Data.” Accessed August 16, 2020.
https://opendata.cityofnewyork.us -
Martindale, Jaime. “Research Guides: Mapping and Geographic Information Systems (GIS): Online Map Resources.” Accessed August 16, 2020. https://researchguides.library.wisc.edu/c.php?g=178144&p=1170424.
-
“Natural Earth.” Accessed August 16, 2020. https://www.naturalearthdata.com/.
-
Pelagios. “Linked Open Data to Navigate the Past: Using Peripleo in Class.” Medium, June 7, 2019. https://medium.com/pelagios/linked-open-data-to-navigate-the-past-using-peripleo-in-class-4286b3089bf3.
-
“Projects | Heurist Network.” Accessed August 16, 2020. http://heuristnetwork.org/projects/.
-
“Recogito in 10 Minutes.” Accessed August 16, 2020.https://recogito.pelagios.org/help/tutorial
-
Rumsey, David. “David Rumsey Map Collection.” Accessed August 16, 2020. https://www.davidrumsey.com/.
-
“Scenario-Simple-Map.Pdf.” Accessed August 16, 2020. http://hdlab.stanford.edu/doc/scenario-simple-map.pdf.
-
“Spatial History Project.” Accessed August 16, 2020. https://web.stanford.edu/group/spatialhistory/cgi-bin/site/index.php.
-
“Spatial Humanities.” Accessed August 16, 2020. https://spatial.scholarslab.org/.
-
StoryMap JS Tutorial, 2017. https://www.youtube.com/watch?v=rSw3ZO8gDgc.

This entry is licensed under a Creative Commons Attribution-NonCommercial-ShareAlike 4.0 International license.